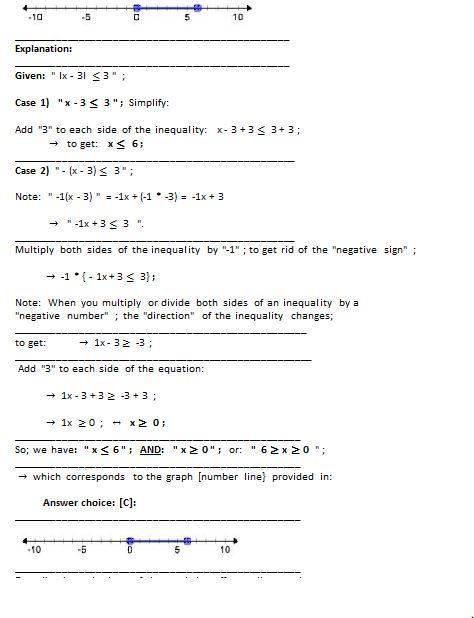
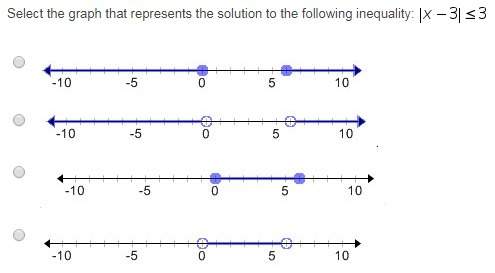
Select the graph that represents the solution to the following inequality: ix-3i< 3
...

Mathematics, 25.07.2019 06:30 jay8682
Select the graph that represents the solution to the following inequality: ix-3i< 3

Answers: 1


Other questions on the subject: Mathematics
Mathematics, 21.06.2019 18:00, kezin
The sat and act tests use very different grading scales. the sat math scores follow a normal distribution with mean 518 and standard deviation of 118. the act math scores follow a normal distribution with mean 20.7 and standard deviation of 5. suppose regan scores a 754 on the math portion of the sat. how much would her sister veronica need to score on the math portion of the act to meet or beat regan's score?
Answers: 1
Mathematics, 21.06.2019 19:00, karellopez96
List the sides of δrst in ascending order (shortest to longest) if: m∠r =x+28°, m∠s = 2x+16°, and m∠t = x+12
Answers: 1
You know the right answer?
Questions in other subjects:

English, 13.07.2019 04:00


Business, 13.07.2019 04:00

Biology, 13.07.2019 04:00


