20
the graph shows the quadratic function f(x) . what is the average rate of change for the q...

Mathematics, 27.11.2019 02:31 Mw3spartan17
20
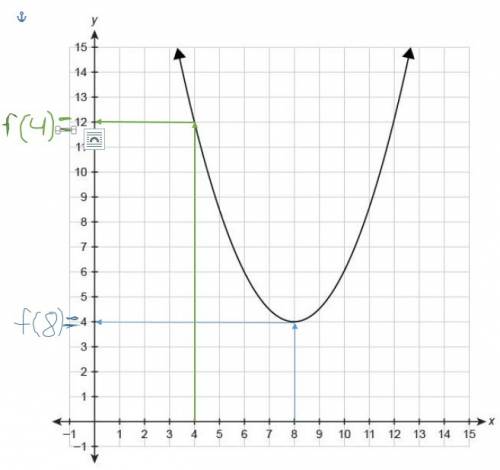
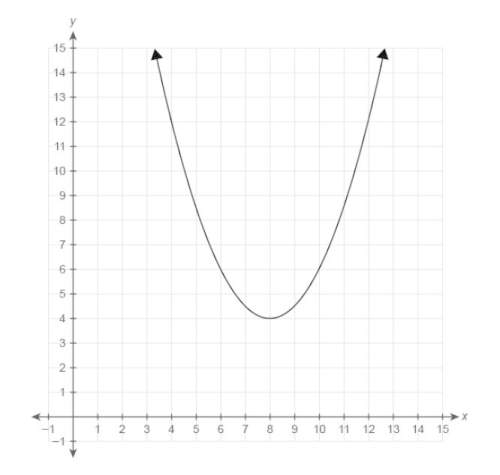
the graph shows the quadratic function f(x) . what is the average rate of change for the quadratic function from x = 4 to x = 8? enter your answer in the box.
(i'll post a photo of the graph)

Answers: 3


Other questions on the subject: Mathematics
Mathematics, 21.06.2019 19:30, jasminetaylor4587
According to the data set, where should the upper quartile line of the box plot be placed?
Answers: 1
Mathematics, 21.06.2019 22:50, leilaford2003
If set d is not the empty set but is a subset of set e, then which of the following is true? d ∩ e = d d ∩ e = e d ∩ e = ∅
Answers: 1
Mathematics, 21.06.2019 23:50, Angel4345
Astudent draws two parabolas both parabolas cross the x axis at (-4,0) and (6,0) the y intercept of the first parabolas is (0,-12). the y intercept of the second parabola is (0,-24) what is the positive difference between the a values for the two functions that describe the parabolas
Answers: 3
You know the right answer?
Questions in other subjects:

Social Studies, 20.11.2021 04:50

Chemistry, 20.11.2021 04:50
Social Studies, 20.11.2021 04:50


Mathematics, 20.11.2021 04:50


