
Mathematics, 06.10.2019 10:02 juelchasse
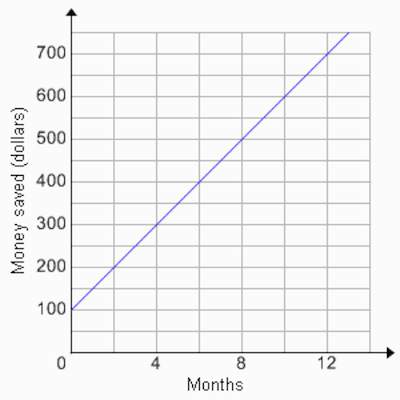
Alex is trying to start a savings plan. the following graph represents his projected savings over the next 12 months. how much money will he have saved by the sixteenth month?
graph with months on the x axis and money saved in dollars on the y axis. graph shows a line hitting points (0, 100), (4, 300), (8, 500), and (12, 700)
$700
$800
$900
$1000

Answers: 1


Other questions on the subject: Mathematics
Mathematics, 21.06.2019 20:50, tra10money
An object is translated by (x + 4, y - 2). if one point in the image has the coordinates (5, -3), what would be the coordinates of its pre-image? (9, -5) (1, -5) (9, -1) (1, -1)
Answers: 1
Mathematics, 21.06.2019 21:00, trinitymarielouis
How do you write y-10=2 (x-8) in standard form
Answers: 1
You know the right answer?
Alex is trying to start a savings plan. the following graph represents his projected savings over th...
Questions in other subjects:


Advanced Placement (AP), 20.06.2020 20:57

Mathematics, 20.06.2020 20:57

Mathematics, 20.06.2020 20:57
Mathematics, 20.06.2020 20:57


