
Mathematics, 26.07.2019 01:00 dontcareanyonemo
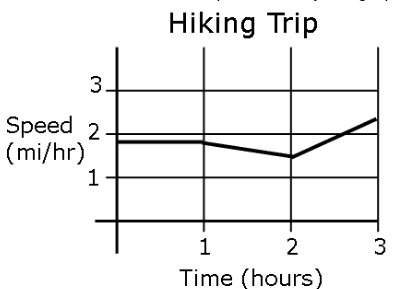
Which situation is best represented by the graph? a hiker starts out at a steady pace for 1 hour. then she constantly increases her speed for the next hour. when she reaches the top of the trail, she heads down at a decreasing rate. a hiker starts out a steady pace for 2 hours. then she constantly decreases her speed for the next hour. when she reaches the top of the trail, she heads down at a decreasing rate. a hiker starts out at a steady pace for 1 hour. then she constantly decreases her speed for the next hour. when she reaches the top of the trail, she head down at an increasing rate. a hiker starts out walking on a level trail for 1 hours. th

Answers: 2


Other questions on the subject: Mathematics
Mathematics, 21.06.2019 20:00, myparentsrock17
Given ab and cb are tangents of p, and m =10°. what is the measure of abp?
Answers: 1
Mathematics, 22.06.2019 02:10, gabrielolivas59
Martha is training for a duathlon, which includes biking and running. she knows that yesterday she covered a total distance of over 55.5 miles in more than than 4.5 hours of training. martha runs at a speed of 6 mph and bikes at a rate of 15.5 mph.
Answers: 1
You know the right answer?
Which situation is best represented by the graph? a hiker starts out at a steady pace for 1 hour. t...
Questions in other subjects:


Physics, 02.01.2020 00:31
Mathematics, 02.01.2020 00:31

English, 02.01.2020 00:31

Mathematics, 02.01.2020 00:31


