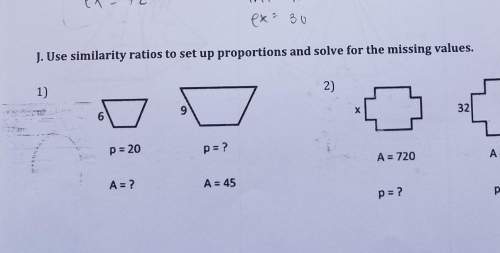
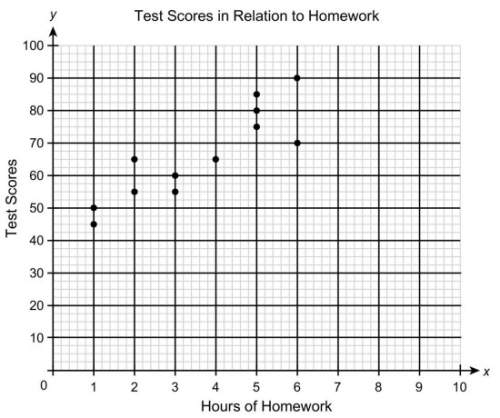
Consider this scatter plot.
(a) how would you characterize the relationship between the hours...

Mathematics, 18.09.2019 01:30 goldenhawk239
Consider this scatter plot.
(a) how would you characterize the relationship between the hours spent on homework and the test
scores? explain.
(b) paul uses the function y = 8x + 40 to model the situation. what score does the model predict for 3 h
of homework?
(c) what does the number 40 in part (b) mean in the context of the situation?

Answers: 2


Other questions on the subject: Mathematics
Mathematics, 21.06.2019 20:00, ellemarshall13
15 there is a line that includes the point 0,10 and has a slope of 7/4. what is it’s equation in slope intercept form
Answers: 1
Mathematics, 21.06.2019 21:00, PotatoBananad
Given: circle o, cd is diameter, chord ab || cd. arc ab = 74°, find arc ca.
Answers: 1
Mathematics, 22.06.2019 00:00, berliedecius4051
Answer this question i need as soon as possible
Answers: 1
You know the right answer?
Questions in other subjects:


Mathematics, 20.04.2021 04:20
Mathematics, 20.04.2021 04:20


