
Use the probability distribution graph to answer the question.
p(x≤a)=0.6
wh...

Mathematics, 27.11.2019 16:31 justinc10
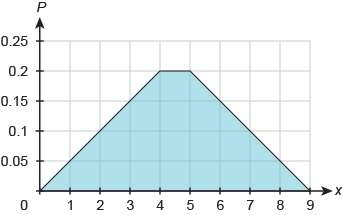
Use the probability distribution graph to answer the question.
p(x≤a)=0.6
what is the value of a?
enter your answer in the box.

Answers: 1


Other questions on the subject: Mathematics
Mathematics, 21.06.2019 18:00, lnbrown9018
Find the number of liters in 12.8 gal of gasoline. round to the nearest hundredths
Answers: 2
Mathematics, 21.06.2019 19:10, chrischris1
In the triangles, bc =de and ac fe. if the mzc is greater than the mze, then ab isdfelth
Answers: 2
Mathematics, 21.06.2019 21:30, gigi6653
Damon makes 20 cups of lemonade by mixing lemon juice and water. the ratio of lemon juice to water is shown in the tape diagram. lemon juice\text{lemon juice} lemon juice water\text{water} water how much lemon juice did damon use in the lemonade? cups
Answers: 3
Mathematics, 21.06.2019 23:30, awsomeboy12345678
Harry the hook has 7 1/3 pounds of cookie dough. she uses 3/5 of it to bake cookie. how much cookie dough does she use to make cookie?
Answers: 1
You know the right answer?
Questions in other subjects:
Mathematics, 20.08.2020 01:01
Mathematics, 20.08.2020 01:01
Mathematics, 20.08.2020 01:01

Arts, 20.08.2020 01:01


Mathematics, 20.08.2020 01:01


