
Mathematics, 27.07.2019 05:30 yourmumsanoodle
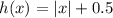
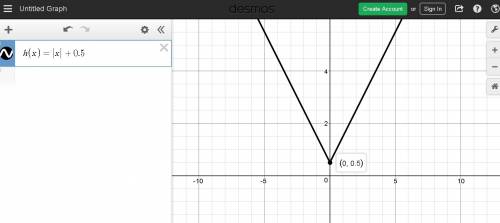
Which graph represents the function h(x) = |x| + 0.5?

Answers: 2


Other questions on the subject: Mathematics
Mathematics, 21.06.2019 22:30, tmrsavage02p7cj16
Consider an example of a deck of 52 cards: example set of 52 playing cards: 13 of each suit clubs, diamonds, hearts, and spades ace 2 3 4 5 6 7 8 9 10 jack queen king clubs diamonds hearts spades what is the probability of drawing three queens from a standard deck of cards, given that the first card drawn was a queen? assume that the cards are not replaced.
Answers: 1
Mathematics, 21.06.2019 23:30, joelpimentel
Which choice has the correct steps in graphing the solution set to the following inequality? -45_> 20x-5y
Answers: 1
Mathematics, 22.06.2019 00:30, daijahbuck
y=2x−1 5x−4y=1 is (1,1)(1,1) a solution of the system?
Answers: 3
You know the right answer?
Which graph represents the function h(x) = |x| + 0.5?...
Questions in other subjects:

English, 17.01.2022 19:10

Chemistry, 17.01.2022 19:10

History, 17.01.2022 19:10
Mathematics, 17.01.2022 19:10

Geography, 17.01.2022 19:10

Social Studies, 17.01.2022 19:10

Computers and Technology, 17.01.2022 19:10

Chemistry, 17.01.2022 19:10


