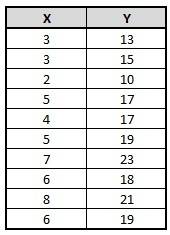
By definition, a scatter plot is a diagram generally used to compare two setz of data. As you can see, in this exercise asked for the relationship between "Age (years)" at the x axis and "Lenght (in)" at the y axis. Therefore, to plot the data given in the problem, you should order the numbers in a table, as you can see in the figure attached. Then, you can plot the following points:
(3,13); (3,15); (2,10); (5,17); (4,17); (5,19); (7,23); (6,18); (8,21); (6,19)
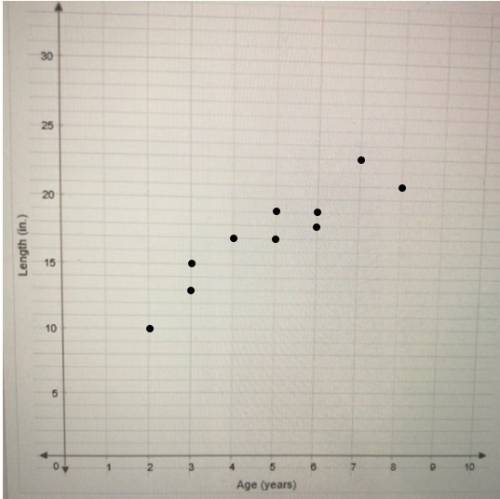
You can see the completed scatter plot in the figure attached.