
Mathematics, 27.12.2019 01:31 justinbailey96
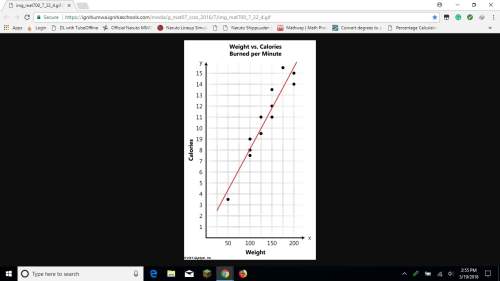
The following scatter plot represents the relationship between a person's weight and the number of calories the person burns in one minute of jump roping.
using the line of best fit, about what weight would a person be if they burned 15 calories per minute?
125 lbs.
150 lbs.
180 lbs.
220 lbs.

Answers: 1


Other questions on the subject: Mathematics
Mathematics, 21.06.2019 21:30, happysage12
Every weekday, mr. jones bikes from his home to his job. sometimes he rides along two roads, the long route that is shown by the solid lines. other times, he takes the shortcut shown by the dashed line. how many fewer kilometers does mr. jones bike when he takes the shortcut instead of the long route?
Answers: 1
You know the right answer?
The following scatter plot represents the relationship between a person's weight and the number of c...
Questions in other subjects:


Chemistry, 14.06.2021 22:50


Mathematics, 14.06.2021 22:50

Geography, 14.06.2021 22:50
Mathematics, 14.06.2021 22:50


