
Mathematics, 28.07.2019 14:30 kaitlynhess
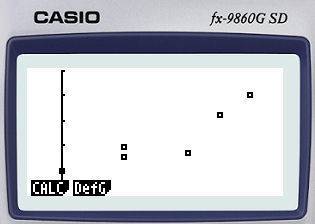
Find the equation of the regression line for the given data. then construct a scatter plot of the data and draw the regression line. (the pair of variables have a significant correlation.) then use the regression equation to predict the value of y for each of the given x-values, if meaningful. the number of hours 6 students spent for a test and their scores on that test are shown below. font size decreased by 1 font size increased by 1 hours spent studying comma xhours spent studying, x 00 22 22 44 55 66 (a) xequals=33 hours (b) xequals=4.54.5 hours test score, y 4040 4545 4949 4747 6262 7070 (c) xequals=1515 hours (d) xequals=2.52.5 hours

Answers: 1


Other questions on the subject: Mathematics
Mathematics, 21.06.2019 19:00, DestyHilBan1183
What are the solutions of the system? solve by graphing. y = -x^2 -6x - 7 y = 2
Answers: 2
You know the right answer?
Find the equation of the regression line for the given data. then construct a scatter plot of the da...
Questions in other subjects:
Mathematics, 07.12.2019 19:31

History, 07.12.2019 19:31


Mathematics, 07.12.2019 19:31
English, 07.12.2019 19:31


