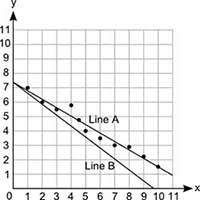
Liam and sarah have each drawn a line on the scatter plot shown below:
which line best repres...

Mathematics, 03.11.2019 02:31 gabby77778
Liam and sarah have each drawn a line on the scatter plot shown below:
which line best represents the line of best fit?
line a, because it shows a positive association
line a, because it is closet to most data points
line b, because it is closest to most data points
line b, because it shows negative association

Answers: 3


Other questions on the subject: Mathematics
Mathematics, 21.06.2019 15:30, shikiaanthony
What is the value of y? round to the nearest tenth
Answers: 2
Mathematics, 21.06.2019 17:30, maddiemalmstrom
Adiverr from the university of florida women’s swimming and diving team is competing in the ncaa zone b championships
Answers: 2
Mathematics, 21.06.2019 22:00, costel8532
Which of the following graphs could represent a cubic function?
Answers: 1
You know the right answer?
Questions in other subjects:

Computers and Technology, 30.07.2019 18:50
Mathematics, 30.07.2019 18:50
Mathematics, 30.07.2019 18:50


Mathematics, 30.07.2019 18:50


