
Mathematics, 29.07.2019 12:00 liamgreene90
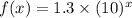
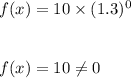
The number of members f(x) in a local swimming club increased by 30% every year over a period of x years. the function below shows the relationship between f(x) and x: f(x) = 10(1.3)x which of the following graphs best represents the function? graph of f of x equals 1.3 multiplied by 10 to the power of x graph of exponential function going up from left to right in quadrant 1 through the point 0, 0 and continuing towards infinity graph of f of x equals 10 multiplied by 1.3 to the power of x graph of f of x equals 1.3 to the power of x

Answers: 1


Other questions on the subject: Mathematics
Mathematics, 22.06.2019 00:30, lacourboud20005
You are riding your bike and notice the square sign above. you mentally draw a straight line from point a to c. describe the angle relationship between dca and bca
Answers: 1
Mathematics, 22.06.2019 00:50, 20alyssityh224
Arectangle has a perimeter of 24 inches. if the width is 5 more than twice the length, what are the dimensions of the rectangle?
Answers: 3
You know the right answer?
The number of members f(x) in a local swimming club increased by 30% every year over a period of x y...
Questions in other subjects:

Mathematics, 12.09.2019 03:30
Mathematics, 12.09.2019 03:30


Mathematics, 12.09.2019 03:30
Mathematics, 12.09.2019 03:30


