
Mathematics, 29.07.2019 15:30 favre22fs
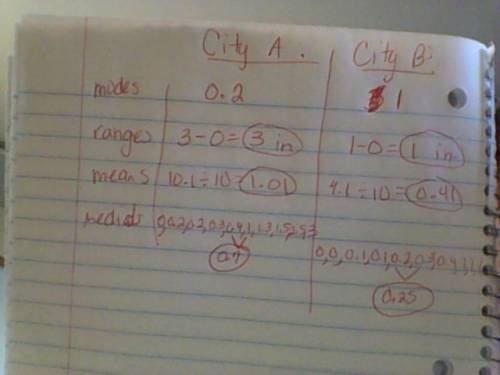
This table shows the weekly rainfall, in inches, for two cities for ten weeks. city a 0.2 0 1.5 1.3 2.5 3 0.4 0.3 0.2 1 city b 0 0 0.4 0.2 0.3 1 1 1 0.1 0.1 which conclusion can be drawn from the data? during the 10 wk period, the rainfall amount recorded most often for city b was 1 in. the range between the maximum and minimum values for city b is greater than the range between the maximum and minimum values for city a. for the ten weeks, city a received less rainfall, on average, than city b the median for city a is less than the median for city b. pls me

Answers: 1


Other questions on the subject: Mathematics
Mathematics, 21.06.2019 16:30, macenzie26
What could explain what happened when the time was equal to 120 minutes
Answers: 2
Mathematics, 21.06.2019 19:20, joelpimentel
Which number line represents the solution set for the inequality - x 24?
Answers: 3
Mathematics, 21.06.2019 21:50, jak000067oyyfia
Which rule describes the composition of transformations that maps ajkl to aj"k"l"? ro. 900 o to, -2(x, y) to, -20 ro, 900(x, y) ro, 9000 t-2. o(x, y) t-2, 00 ro, 900(x, y)
Answers: 2
You know the right answer?
This table shows the weekly rainfall, in inches, for two cities for ten weeks. city a 0.2 0 1.5 1.3...
Questions in other subjects:

Biology, 03.09.2020 17:01


Mathematics, 03.09.2020 17:01


