
Mathematics, 05.10.2019 18:00 mercedezosborne
Part one: how do you solve a system of equations approximately using graphs and tables?
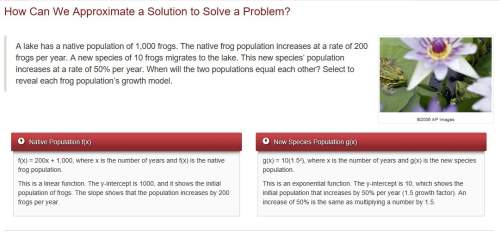
part 2: a lake has a native population of 1,000 frogs. the native frog population increases at a rate of 200 frogs per year. a new species of 10 frogs migrates to the lake. this new species’ population increases at a rate of 50% per year. when will the two populations equal each other? select to reveal each frog population’s growth model.
the rest: a system of equations can be created with the two functions to determine when the populations will have the same population output value, y.
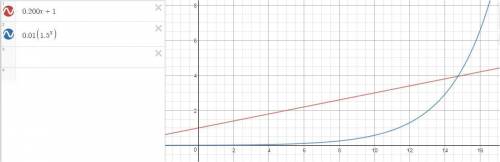
y = 200x + 1,000
y = 10(1.5x)
to determine when the populations will be equal, set the equations equal to each other, and solve for x.
200x + 1,000 = 10(1.5x)
this equation is a little more challenging to solve by algebraic methods. in this lesson, you will solve systems of equations like the one above approximately by effectively using technology and tables.

Answers: 1


Other questions on the subject: Mathematics
Mathematics, 21.06.2019 15:20, lambobacon9027
Classify the following triangle check all that apply
Answers: 2
Mathematics, 21.06.2019 19:00, ethangeibel93
In a class, there are 12 girls. if the ratio of boys to girls is 5: 4 how many boys are there in the class
Answers: 1
You know the right answer?
Part one: how do you solve a system of equations approximately using graphs and tables?
Questions in other subjects:
Mathematics, 21.10.2020 18:01
Mathematics, 21.10.2020 18:01


Social Studies, 21.10.2020 18:01

History, 21.10.2020 18:01

Biology, 21.10.2020 18:01
History, 21.10.2020 18:01


