
Mathematics, 30.07.2019 00:00 vanessagallion
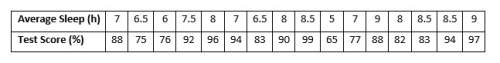
The table shows the test scores and the sleep averages of several students. a. write the least squares regression equation that models the data. let x = hours of sleep and y = test score. b. find the correlation coefficient (r value). explain what this tells you about the association of the data. be sure to describe both the strength and direction in your explanation. c. use the equation to determine the approximate test score of a student who sleeps an average of 8 h a night. show your work.

Answers: 1


Other questions on the subject: Mathematics
Mathematics, 21.06.2019 21:50, kaylaamberd
Suppose that the price p, in dollars, and the number of sales, x, of a certain item follow the equation 4 p plus 4 x plus 2 pxequals56. suppose also that p and x are both functions of time, measured in days. find the rate at which x is changing when xequals2, pequals6, and startfraction dp over dt endfraction equals1.5.
Answers: 2
Mathematics, 22.06.2019 00:00, lazymarshmallow7
50 will mark show all use the linear combination method to solve the system of equations. explain each step of your solution. if steps are not explained, you will not receive credit for that step. 2x+9y= -26 -3x-7y=13
Answers: 1
Mathematics, 22.06.2019 01:30, fraven1819
If the segment op is dilated by a scale factor r=2, what is the length of segment op? a)10cm b)16cm c)6cm d)4cm
Answers: 1
You know the right answer?
The table shows the test scores and the sleep averages of several students. a. write the least squar...
Questions in other subjects:

History, 02.09.2019 02:30
Mathematics, 02.09.2019 02:30


Arts, 02.09.2019 02:30


