
Mathematics, 30.07.2019 01:00 deannajd03
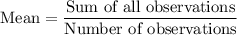
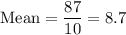
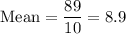
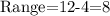
The table shows the number of hours two groups of teens spent on science and math homework last week. each group was made up of 10 teens. 13- to 14-year olds 10 9 11 8 10 10 2 7 8 12 15- to 16-year olds 12 10 8 11 12 12 6 4 4 10 select from the drop-down menus to correctly complete each statement. the mean hours the groups of teens spent studying is , the range for the two groups of of teens is .

Answers: 1


Other questions on the subject: Mathematics
Mathematics, 21.06.2019 20:10, paigeleahfarbeoy2ork
Which ratios are equivalent to 10: 16? check all that apply. 30 to 48 25: 35 8: 32 5 to 15
Answers: 1
Mathematics, 22.06.2019 02:00, matius0711
Pleasseee important quick note: enter your answer and show all the steps that you use to solve this problem in the space provided. use the circle graph shown below to answer the question. a pie chart labeled favorite sports to watch is divided into three portions. football represents 42 percent, baseball represents 33 percent, and soccer represents 25 percent. if 210 people said football was their favorite sport to watch, how many people were surveyed?
Answers: 2
Mathematics, 22.06.2019 03:30, macylen3900
Arock was dropped from the top of a building. the function that describes the height after it was dropped is f(x)=64-16x^2. what are the zeros of the function and what do they mean?
Answers: 1
You know the right answer?
The table shows the number of hours two groups of teens spent on science and math homework last week...
Questions in other subjects:

History, 29.08.2019 18:00

Health, 29.08.2019 18:00

Biology, 29.08.2019 18:00
Mathematics, 29.08.2019 18:00
History, 29.08.2019 18:00

Geography, 29.08.2019 18:00

Mathematics, 29.08.2019 18:00


