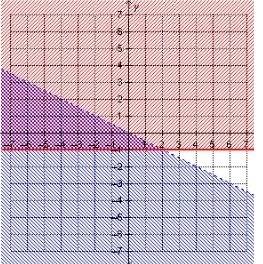
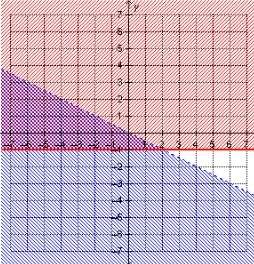
 are system of inequalities is represented by the graph.
Step-by-step explanation:
We are given four option and need to choose correct inequality for given graph.
In graph, we can see two line
Red line: It is horizontal solid line passing through (0,-1) and shaded region above the line.
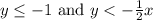
Equation of line: y≥-1
Blue line: It is slant dotted line passing through origin and (-2,1)
Equation of line: 
System of inequalities represented by the graph.
Thus, are system of inequalities is represented by the graph.