
Mathematics, 21.08.2019 19:30 sierrastrickland99
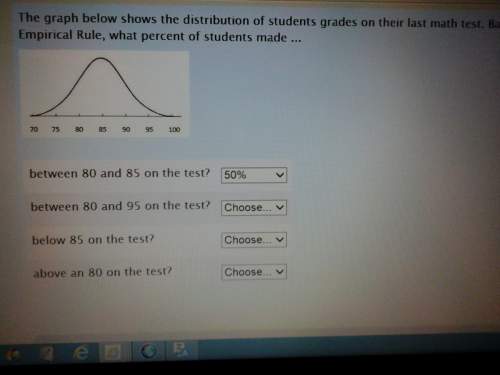
The graph below shows the distribution of students grades on their last math test. based on the empirical rule, what percent of students made..
*btwn 80 n 85 on the test?
*btwn 80 n 95 on the test?
* below 85 on the test?
*above an 80 on the test?

Answers: 1


Other questions on the subject: Mathematics
You know the right answer?
The graph below shows the distribution of students grades on their last math test. based on the empi...
Questions in other subjects:

History, 01.10.2021 01:30

English, 01.10.2021 01:30


Mathematics, 01.10.2021 01:30

Social Studies, 01.10.2021 01:30


