35
the scatter plot shows the relationship betweeen the number of hours students spend watchi...

Mathematics, 05.10.2019 15:00 peytonhause20
35
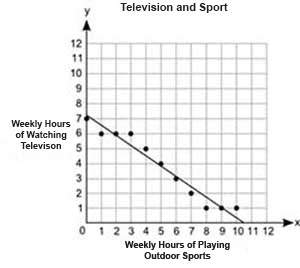
the scatter plot shows the relationship betweeen the number of hours students spend watching television and the numer of hours they spend playing outdoor sports each week.
a graph is titled television and sport. on the x axis, the label is weekly hours of
what is the y-intercept of the line of best fit and what does it represent?
a 10.4 hours; the number of hours students play outdoor sports in a week when they do not watch television
b 7.2 hours; the number of hours students play outdoor sports in a week when they do not watch television
c 10.4 hours; the number of hours students watch television in a week when they do not participate in any outdoor sports
d 7.2 hours; the number of hours students watch television in a week when they do not participate in any outdoor sports

Answers: 2


Other questions on the subject: Mathematics
Mathematics, 21.06.2019 16:40, lauramount
According to the number line, what is the distance between points a and b? v ++ + + + + -16 -14 -12 -10 -8 + 6 + 4 + -2 + 0 + 2 + 4 + 6 + 8 + 10 + 12 + 14 + 16 o6 units o 7 units 12 units o 14 units
Answers: 1
Mathematics, 22.06.2019 00:30, citlalli30
Candice uses the function f(t)=t+100−−−−−−√ to model the number of students in her after-school program. the variable t represents days and f(t) represents the number of students. how many days does it take for there to be 15 students in her program? a. 225 days b. 125 days c. 325 days d. 115 days
Answers: 2
Mathematics, 22.06.2019 01:00, dommalb
The dance committee of pine bluff middle school earns $72 from a bake sale and will earn $4 for each ticket they sell to the spring fling dance. the dance will cost $400 write an inequality to determine the number, t of tickets the committee could sell to have money left over after they pay for this year's dance. what is the solution set of the inequality?
Answers: 2
You know the right answer?
Questions in other subjects:


History, 26.06.2019 05:00

Mathematics, 26.06.2019 05:00

History, 26.06.2019 05:00


Mathematics, 26.06.2019 05:00


