
Mathematics, 22.10.2019 04:10 ayoismeisalex
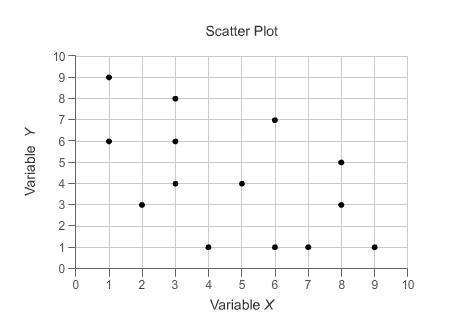
Naomi plotted the graph below to show the relationship between the temperature of her city and the number of popsicles she sold daily:
part a: in your own words, describe the relationship between the temperature of the city and the number of popsicles sold. (2 points)
part b: describe how you can make the line of best fit. write the approximate slope and y-intercept of the line of best fit. show your work, including the points that you use to calculate the slope and y-intercept. (3 points)


Answers: 1


Other questions on the subject: Mathematics
Mathematics, 21.06.2019 21:00, cinthyafleitas
What number line represents the solution set for the inequality -1/2 greater than or equal to 4
Answers: 1
Mathematics, 21.06.2019 22:50, tali2561
Aclassroom is made up of 11 boys and 14 girls. the teacher has four main classroom responsibilities that she wants to hand out to four different students (one for each of the four students). if the teacher chooses 4 of the students at random, then what is the probability that the four students chosen to complete the responsibilities will be all boys?
Answers: 1
Mathematics, 21.06.2019 23:40, haybales6019
Cos^2x+cos^2(120°+x)+cos^2(120°-x)i need this asap. pls me
Answers: 1
You know the right answer?
Naomi plotted the graph below to show the relationship between the temperature of her city and the n...
Questions in other subjects:
Mathematics, 02.07.2019 12:40

Chemistry, 02.07.2019 12:40

Mathematics, 02.07.2019 12:40

History, 02.07.2019 12:40
Mathematics, 02.07.2019 12:40

English, 02.07.2019 12:40


