
Mathematics, 31.07.2019 14:00 lullexxxx
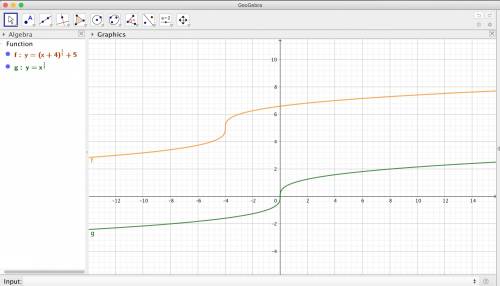
The graph of ![y= \sqrt[3]{x}](/tex.php?f=y= \sqrt[3]{x} ) was shifted 5 units down and 4 units to the left. what is the equation of the resulting graph? answer quickly!
was shifted 5 units down and 4 units to the left. what is the equation of the resulting graph? answer quickly!

Answers: 1
![y= \sqrt[3]{x}](/tpl/images/0154/5939/9e9af.png) . To shift the graph horizontally by c units, we have to put c inside the parentheses, that is, under the cube-root. Now, we want to move the graph four units to the left. To do that, we write
. To shift the graph horizontally by c units, we have to put c inside the parentheses, that is, under the cube-root. Now, we want to move the graph four units to the left. To do that, we write ![y= \sqrt[3]{x+4}](/tpl/images/0154/5939/05df1.png) . Notice that we put +4, and not –4. That may seem a bit counterintuitive, but think that the value that gave some f(x) in the original function must now be four more than it to get the same value. If that explanation confuse you, don't worry; just remember for the horizontal shift it's the opposite sign.
. Notice that we put +4, and not –4. That may seem a bit counterintuitive, but think that the value that gave some f(x) in the original function must now be four more than it to get the same value. If that explanation confuse you, don't worry; just remember for the horizontal shift it's the opposite sign.![y= \sqrt[3]{x+4}+5](/tpl/images/0154/5939/e144a.png) .
.
 was shifted 5 units down and 4 units to the left. what is th" />

Other questions on the subject: Mathematics
Mathematics, 21.06.2019 21:30, hailey200127
A. s.a.! similarity in right triangles, refer to the figure to complete this proportionc/a = a/? a.) cb.) hc.) rd.) s
Answers: 1
Mathematics, 22.06.2019 01:30, jude40
Asample of 200 rom computer chips was selected on each of 30 consecutive days, and the number of nonconforming chips on each day was as follows: the data has been given so that it can be copied into r as a vector. non. conforming = c(10, 15, 21, 19, 34, 16, 5, 24, 8, 21, 32, 14, 14, 19, 18, 20, 12, 23, 10, 19, 20, 18, 13, 26, 33, 14, 12, 21, 12, 27) #construct a p chart by using the following code. you will need to enter your values for pbar, lcl and ucl. pbar = lcl = ucl = plot(non. conforming/200, ylim = c(0,.5)) abline(h = pbar, lty = 2) abline(h = lcl, lty = 3) abline(h = ucl, lty = 3)
Answers: 3
Mathematics, 22.06.2019 04:00, floressavanna15
The graph shows the first four ordered pairs formed by the corresponding terms of two patterns. which ordered pair would be the fifth point on this graph? a. 12,8 b. 12,4 c. 10,4 d. 4,12
Answers: 1
You know the right answer?
The graph of [tex]y= \sqrt[3]{x} [/tex] was shifted 5 units down and 4 units to the left. what is th...
Questions in other subjects:
Mathematics, 21.01.2022 14:00
Mathematics, 21.01.2022 14:00

Mathematics, 21.01.2022 14:00


History, 21.01.2022 14:00


Social Studies, 21.01.2022 14:00


