Look at the data in the table below
x y
4. 9
12. 28
...

Mathematics, 31.01.2020 11:48 nssjdjsididiodododod
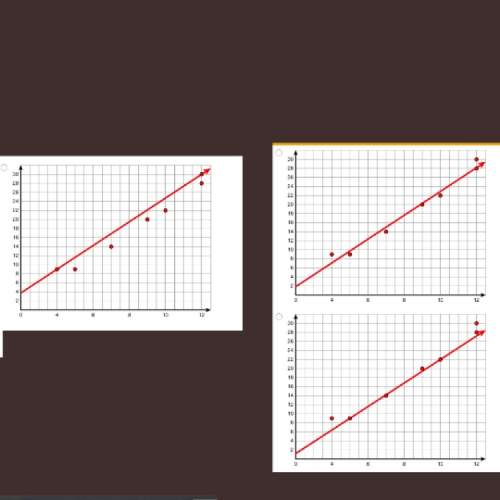
Look at the data in the table below
x y
4. 9
12. 28
7. 14
9. 20
5. 9
12. 30
10. 22
which graph shows the best fit for this data

Answers: 1


Other questions on the subject: Mathematics
Mathematics, 21.06.2019 18:20, katlynnschmolke
What is the solution set of the quadratic inequality x2- 5< 0? o {xl-55x55{x- 155x55){xl -55x5 15){x1 - 15 sx5/5)
Answers: 2
You know the right answer?
Questions in other subjects:
Mathematics, 17.12.2021 01:00

Business, 17.12.2021 01:00
Mathematics, 17.12.2021 01:00

Chemistry, 17.12.2021 01:00


Mathematics, 17.12.2021 01:00


