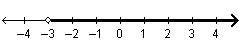
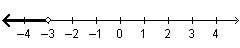
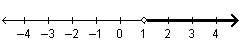
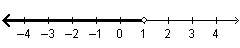
Which graph shows the solution to the inequality -x + 2 > 1
...

Mathematics, 25.11.2019 01:31 anaber524
Which graph shows the solution to the inequality -x + 2 > 1

Answers: 3


Other questions on the subject: Mathematics
Mathematics, 21.06.2019 22:30, jcazares3558
Abag contains 10 white golf balls and 6 striped golf balls. a golfer wants to add 112 golf balls to the bag. he wants the ratio of white to striped gold balls to remain the same. how many of each should he add?
Answers: 2
Mathematics, 21.06.2019 23:30, lanlostreyn
Peyton's field hockey team wins 4 games out of every 7 games played. her team lost 9 games. how many games did peyton's team play?
Answers: 2
Mathematics, 21.06.2019 23:30, DesperatforanA
Tim earns $120 plus $30 for each lawn he mows. write an iniqualityvto represent how many lawns he needs to mow to make more than $310
Answers: 2
You know the right answer?
Questions in other subjects:

Mathematics, 22.04.2021 19:20
Mathematics, 22.04.2021 19:20

Biology, 22.04.2021 19:20

Computers and Technology, 22.04.2021 19:20
Mathematics, 22.04.2021 19:20


