
Mathematics, 01.08.2019 00:30 bri1334
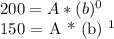
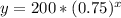
(100+ points) a fresh cup of coffee is placed on a table to cool. the table below shows the relationship between the temperature of the coffee, y, as it relates to time in minutes, x. time (minutes), x 0 1 2 3 temperature (f°), y 200 150 112.5 84.375 which function can be used to represent the relationship shown in the table? y = (0.75) x y = 0.75(200) x y = 200(-0.75) x y = 200(0.75) x

Answers: 2


Other questions on the subject: Mathematics
Mathematics, 21.06.2019 17:00, chrisraptorofficial
Ben is three times as old as samantha, who is two years older than half of michel's age. if michel is 12. how old is ben?
Answers: 1
You know the right answer?
(100+ points) a fresh cup of coffee is placed on a table to cool. the table below shows the relatio...
Questions in other subjects:


Mathematics, 10.09.2019 02:10

Chemistry, 10.09.2019 02:10
History, 10.09.2019 02:10
Mathematics, 10.09.2019 02:10


