
Mathematics, 01.12.2019 08:31 lesmontoya10
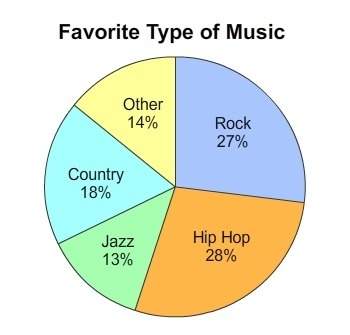
This circle graph shows the results of a survey that asked people to identify their favorite type of music.
what percent of people chose rock or country as their favorite type of music?
9%
35%
45%
55%

Answers: 2


Other questions on the subject: Mathematics
Mathematics, 21.06.2019 17:00, tifftiff22
The volume of a cube is 8 in to the 3rd power. how long is each side?
Answers: 1
Mathematics, 21.06.2019 18:30, nickname0097
Barbara deposited $300 in the bank. if the bank pays her simple interest at the rate of 4 percent per year, how much money will she have in her account at the end of 9 months?
Answers: 1
You know the right answer?
This circle graph shows the results of a survey that asked people to identify their favorite type of...
Questions in other subjects:

Biology, 30.04.2021 01:00
Mathematics, 30.04.2021 01:00
Mathematics, 30.04.2021 01:00

Biology, 30.04.2021 01:00


Chemistry, 30.04.2021 01:00


