
Mathematics, 01.08.2019 22:00 tyreert1720
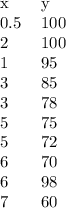
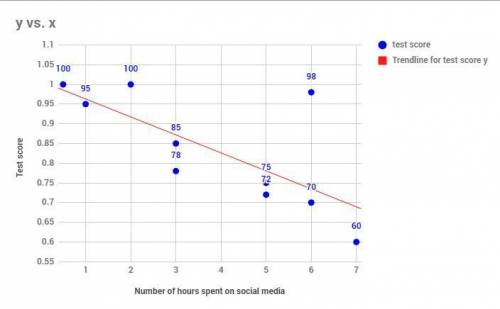
The scatter plot shows the relationship between the test scores of a group of students and the number of hours they spend on social media in a week: a scatter plot is shown. the x-axis is labeled hours spent on social media, and the y-axis is labeled test score. data points are located at 0.5 and 100, 2 and 100, 1 and 95, 3 and 85, 3 and 78, 5 and 75, 5 and 72, 6 and 70, 6 and 98, 7 and 60. a circle labeled a includes all of the points except for the one at 6 and 98. point 6 and 98 is labled b. part a: what is the group of points labeled a called? what is the point labeled b called? give a possible reason for the presence of point b. (3 points) part b: describe the association between a student’s test scores and the number of hours spent on social media. (2 points)

Answers: 1


Other questions on the subject: Mathematics
Mathematics, 21.06.2019 21:00, angelaguero536
In the field of thermodynamics, rankine is the unit used to measure temperature. one can convert temperature from celsius into rankine using the formula , what is the temperature in celsius corresponding to r degrees rankine? a. 9/5(c - 273) b. 9/5(c + 273) c. 5/9( c - 273) d. 5/9( c + 273)
Answers: 1
You know the right answer?
The scatter plot shows the relationship between the test scores of a group of students and the numbe...
Questions in other subjects:
Engineering, 17.06.2021 17:00


English, 17.06.2021 17:00


Social Studies, 17.06.2021 17:00
Mathematics, 17.06.2021 17:00


