
Mathematics, 02.08.2019 10:00 alvaradorosana05
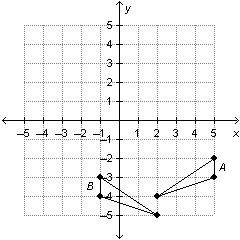
Figure a below is translated 4 units left and 1 unit down and then reflected over the y-axis. which best explains whether figure b is the image of figure a under the specified transformations? a. figure b is not the image of figure a because the triangles are not congruent. b. figure b is not the image of figure a because the transformations were performed in an incorrect order. c. there is not enough information to determine whether figure b is the image of figure a after the transformations. d. figure b is the image of figure a. the transformations were performed correctly.

Answers: 2


Other questions on the subject: Mathematics
Mathematics, 21.06.2019 14:00, KillerSteamcar
What are the critical values that correspond to a 95% confidence level and a sample size of 93? a. 65.647, 118.136 b. 59.196, 128.299 c. 57.143, 106.629 d. 69.196, 113.145
Answers: 3
Mathematics, 21.06.2019 16:50, catdog5225
The table represents a linear function. what is the slope of the function? –6 –4 4 6
Answers: 3
Mathematics, 21.06.2019 20:30, nathanscastr02
The graph of y x3 is translated so that the point (1. 1) is moved to (1, 4). what is the equation of the new graph?
Answers: 1
You know the right answer?
Figure a below is translated 4 units left and 1 unit down and then reflected over the y-axis. which...
Questions in other subjects:


History, 26.03.2020 18:41
Mathematics, 26.03.2020 18:41
Biology, 26.03.2020 18:41


