
Mathematics, 15.11.2019 10:31 medellincolombia99
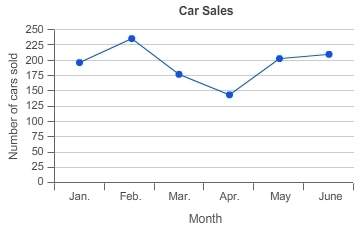
The graph shows the number of cars sold at a car dealership over a 6-month period. about how many more cars were sold in june than in april?
a) 10
b) 50
c) 75
d) 105

Answers: 2


Other questions on the subject: Mathematics
Mathematics, 22.06.2019 00:00, jair512872
What is the value of x in this triangle? a. 53° b. 62° c. 65° d. 118°
Answers: 2
Mathematics, 22.06.2019 02:00, paulinahunl17
What is the area of this figure. select from the drop down box menu to correctly complete the statement shows a rectangle 3in. by 16in. and a trapezoid center is 10 in. by 5 in. answers are 128 136 153 258
Answers: 2
You know the right answer?
The graph shows the number of cars sold at a car dealership over a 6-month period. about how many mo...
Questions in other subjects:

Arts, 15.04.2020 22:06
Mathematics, 15.04.2020 22:06


