 = -1
= -1  =
=  = 2
= 2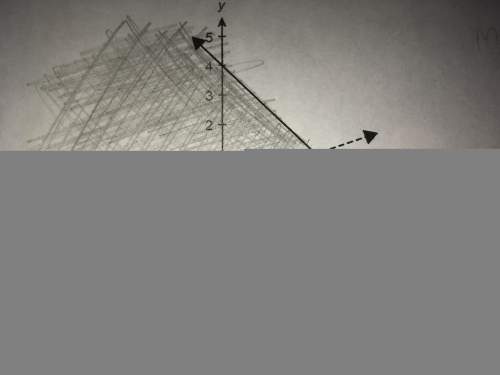
The graph below represents which system of inequalities?
a)y > 2x − 3
y > −x −...

Mathematics, 20.09.2019 03:00 wadepoolio8836
The graph below represents which system of inequalities?
a)y > 2x − 3
y > −x − 3
b)y < 2x − 2
y < −x + 3
c)y ≤ 2x − 2
y > −x + 3
none of the above

Answers: 2


Other questions on the subject: Mathematics
Mathematics, 21.06.2019 16:00, ramirezzairap2u4lh
Data are collected to see how many ice-cream cones are sold at a ballpark in a week. day 1 is sunday and day 7 is the following saturday. use the data from the table to create a scatter plot.
Answers: 2
Mathematics, 21.06.2019 17:00, edjiejwi
Determine the fraction of total interest owed. after the fourth month of a 12-month loan: the numerator is: {(n + ) + (n + ) + (n + ) + (n + )} = , and the denominator is: {(n) + (n + 1) + + (n + )} = . therefore, the fraction is numerator/denominator (to the nearest tenth) =
Answers: 1
Mathematics, 21.06.2019 21:00, ShahinF7536
Graph the equationy=x^2 -[tex]y = x^{2} - 2[/tex]
Answers: 1
You know the right answer?
Questions in other subjects:


Mathematics, 14.01.2022 01:00
History, 14.01.2022 01:00
Mathematics, 14.01.2022 01:00
Mathematics, 14.01.2022 01:00


