
Mathematics, 02.10.2019 22:30 mchillery1028
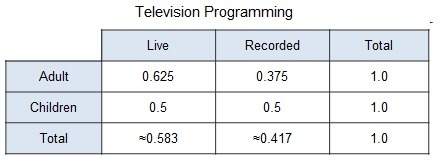
The conditional relative frequency table was calculated by row using data from a survey of one station’s television programming. the survey compared the target audience with the type of show, either live or recorded, over a 24-hour time period.
which is the best description of the value 0.375 in the table?
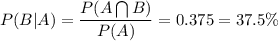
given that the program was targeted at adults, there is a 37.5% chance that it was recorded.
given that the program was recorded, there is a 37.5% chance that it was targeted at adults.
37.5% of the programs are targeted at adults.
37.5% of the programs are recorded.

Answers: 2


Other questions on the subject: Mathematics
Mathematics, 21.06.2019 16:00, ashleyremon901
What is the value of x? enter your answer in the box. x = two intersecting tangents that form an angle of x degrees and an angle of 134 degrees.
Answers: 3
Mathematics, 21.06.2019 22:30, yettionajetti
In order to be invited to tutoring or extension activities a students performance 20 point higher or lower than average for the
Answers: 1
Mathematics, 21.06.2019 23:00, janeou17xn
Mike wants to make meatloaf. his recipe uses a total of 8 pounds of meat. if he uses a 3 to 1 ratio of beef to pork, how much pork will he use? enter your answer as a mixed number in simplest terms.
Answers: 1
You know the right answer?
The conditional relative frequency table was calculated by row using data from a survey of one stati...
Questions in other subjects:


