Explain your answer!
what equation is graphed in this figure?
y−4=−2/3(x+2)
y+2=...

Mathematics, 22.09.2019 23:30 qholmes02
Explain your answer!
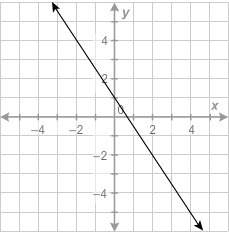
what equation is graphed in this figure?
y−4=−2/3(x+2)
y+2=−3/2(x−2)
y+1=−2/3(x−3)
y−3=3/2(x+1)

Answers: 1


Other questions on the subject: Mathematics
Mathematics, 21.06.2019 12:30, shardaeheyward139
What is the equation in point slope form of the line that passes through the point (-1, -3) and has a slope of 4? y-1=4(x-3) or y+3=4(x+1)
Answers: 1
Mathematics, 21.06.2019 17:30, tatedason33741
Tom wants to order tickets online so that he and three of his friends can go to a water park the cost of the tickets is 16.00 per person there is also a 2.50 one-time service fee for ordering tickets online write an expression in term of n that represents the cost for n ordering tickets online
Answers: 1
Mathematics, 21.06.2019 17:30, redbenji1687
Describe the 2 algebraic methods you can use to find the zeros of the function f(t)=-16t^2+400.
Answers: 3
Mathematics, 21.06.2019 18:00, xxaurorabluexx
Suppose you are going to graph the data in the table. minutes temperature (°c) 0 -2 1 1 2 3 3 4 4 5 5 -4 6 2 7 -3 what data should be represented on each axis, and what should the axis increments be? x-axis: minutes in increments of 1; y-axis: temperature in increments of 5 x-axis: temperature in increments of 5; y-axis: minutes in increments of 1 x-axis: minutes in increments of 1; y-axis: temperature in increments of 1 x-axis: temperature in increments of 1; y-axis: minutes in increments of 5
Answers: 2
You know the right answer?
Questions in other subjects:

Social Studies, 26.05.2020 23:58

Mathematics, 26.05.2020 23:58
History, 26.05.2020 23:58


Mathematics, 26.05.2020 23:58

Biology, 26.05.2020 23:58


