
Mathematics, 30.07.2019 08:40 ramoj0569
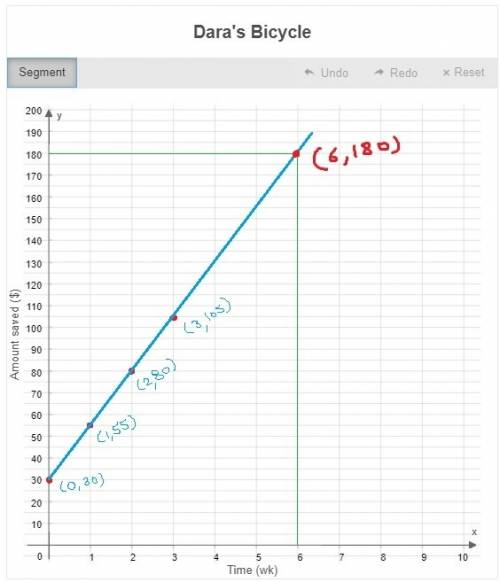
15 points for your ! ! dara needs $180 to pay for a new bicycle. she has $30 already and saves $25 a week that she earns pet sitting. use the segment tool to plot a graph representing the amount of money dara has saved from the time she begins saving until she has saved enough for the bike.

Answers: 1


Other questions on the subject: Mathematics
Mathematics, 21.06.2019 13:30, hsjsjsjdjjd
1. the following set of data represents the number of waiting times in minutes from a random sample of 30 customers waiting for service at a department store. 4 5 7 10 11 11 12 12 13 15 15 17 17 17 17 17 18 20 20 21 22 22 23 24 25 27 27 31 31 32 a. determine the number of classes and class interval.
Answers: 3
Mathematics, 21.06.2019 20:20, leximae2186
Consider the following estimates from the early 2010s of shares of income to each group. country poorest 40% next 30% richest 30% bolivia 10 25 65 chile 10 20 70 uruguay 20 30 50 1.) using the 4-point curved line drawing tool, plot the lorenz curve for bolivia. properly label your curve. 2.) using the 4-point curved line drawing tool, plot the lorenz curve for uruguay. properly label your curve.
Answers: 2
You know the right answer?
15 points for your ! ! dara needs $180 to pay for a new bicycle. she has $30 already and saves $2...
Questions in other subjects:

Geography, 04.11.2019 04:31

Mathematics, 04.11.2019 04:31
Mathematics, 04.11.2019 04:31
Mathematics, 04.11.2019 04:31

Physics, 04.11.2019 04:31
Mathematics, 04.11.2019 04:31
Mathematics, 04.11.2019 04:31


