
Mathematics, 29.07.2019 18:40 6mario5
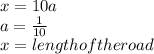
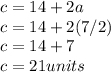
3roads, a, b, and c. b is three times longer than a. c is twice as long and b. draw the roads. what fraction of the total length of the roads is the length of a? if road b is 7 miles longer than road a, what is the length of road c?

Answers: 1


Other questions on the subject: Mathematics
Mathematics, 21.06.2019 18:30, rocksquad9125
Ricky takes out a $31,800 student loan to pay his expenses while he is in college. after graduation, he will begin making payments of $190.66 per month for the next 30 years to pay off the loan. how much more will ricky end up paying for the loan than the original value of $31,800? ricky will end up paying $ more than he borrowed to pay off the loan.
Answers: 1
Mathematics, 21.06.2019 18:30, 128585
Adoctor administers a drug to a 38-kg patient, using a dosage formula of 50 mg/kg/day. assume that the drug is available in a 100 mg per 5 ml suspension or in 500 mg tablets. a. how many tablets should a 38-kg patient take every four hours? b. the suspension with a drop factor of 10 ggt/ml delivers the drug intravenously to the patient over a twelve-hour period. what flow rate should be used in units of ggt/hr? a. the patient should take nothing pills every four hours. (type an integer or decimal rounded to the nearest hundredth as needed.)
Answers: 1
Mathematics, 21.06.2019 23:30, ashiteru123
The average daily maximum temperature for laura’s hometown can be modeled by the function f(x)=4.5sin(πx/6)+11.8 , where f(x) is the temperature in °c and x is the month. x = 0 corresponds to january. what is the average daily maximum temperature in may? round to the nearest tenth of a degree if needed. use 3.14 for π .
Answers: 1
Mathematics, 22.06.2019 01:00, s27511583
The weight of 46 new patients of a clinic from the year 2018 are recorded and listed below. construct a frequency distribution, using 7 classes. then, draw a histogram, a frequency polygon, and an ogive for the data, using the relative information from the frequency table for each of the graphs. describe the shape of the histogram. data set: 130 192 145 97 100 122 210 132 107 95 210 128 193 208 118 196 130 178 187 240 90 126 98 194 115 212 110 225 187 133 220 218 110 104 201 120 183 124 261 270 108 160 203 210 191 180 1) complete the frequency distribution table below (add as many rows as needed): - class limits - class boundaries - midpoint - frequency - cumulative frequency 2) histogram 3) frequency polygon 4) ogive
Answers: 1
You know the right answer?
3roads, a, b, and c. b is three times longer than a. c is twice as long and b. draw the roads. what...
Questions in other subjects:

English, 26.02.2021 23:00

History, 26.02.2021 23:00

Arts, 26.02.2021 23:00
Mathematics, 26.02.2021 23:00

Mathematics, 26.02.2021 23:00


