Mathematics, 29.01.2020 20:58 raheeeq
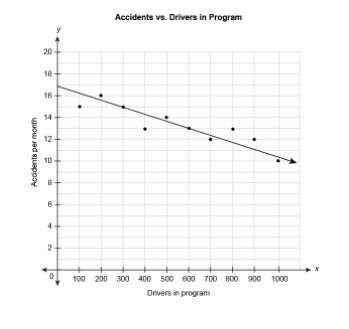
the scatter plot shows the relationship between the number of car accidents in a month and the number of drivers attending a program on distracted driving. the equation represents the linear model for this data.
y=−0.0067x+17
what does the number 17 in the equation mean in this context?
a)there were no accidents per month when there were 17 drivers in the program.
b)the number of accidents decreases by 17 for every 100 drivers in the program.
c)for every 100 drivers in the program, there are 17 accidents per month.
d)there were 17 drivers in the program when it started.
e)there were 17 accidents per month when there were no drivers in the program.


Answers: 2


Other questions on the subject: Mathematics

Mathematics, 21.06.2019 22:40, katerin3499
Explain in a minimum of 2 sentences how to graph the equation of the absolute value function given a vertex of (-1,3) and a value of “a” equal to ½.
Answers: 2

Mathematics, 21.06.2019 23:00, shawdyylinda
The architect's side view drawing of a saltbox-style house shows a post that supports the roof ridge. the support post is 8 ft tall. the distance from the front of the house to the support post is less than the distance from the post to the back of the house. how far from the front of the house is the support post positioned?
Answers: 1


Mathematics, 22.06.2019 02:00, Dweath50
Look at this system of equations. -3x + 3y = 12 y = x + 4 the solution set of this system is best explained by which of these statements? a) the graphs of the equations are the same line because the equations have the same slope and the same y-intercept. the system has infinitely many solutions. b) the graphs of the equations are parallel lines because they have the same slope but different y-intercepts. the system has no solution. c) the graphs of the equations are lines that intersect at one point because the equations have the same slope but different y-intercepts. the system has exactly one solution. d) the graphs of the equations are lines that intersect at one point because the equations have the same slope and the same y-intercept. the system has exactly one solution.
Answers: 2
You know the right answer?
the scatter plot shows the relationship between the number of car accidents in a month and the numbe...
Questions in other subjects:


Mathematics, 19.02.2021 21:40


English, 19.02.2021 21:40


Mathematics, 19.02.2021 21:40


Chemistry, 19.02.2021 21:40


