
Mathematics, 28.07.2019 19:40 Jocelyn0925
Look at the graph below: first line joins ordered pairs negative 4, 3 and 2, negative 3. second line joins negative 4, negative 3 and 2, 3. part a shaded above first and second line. part b shaded below first line and above second line. part c shaded below first and second lines. part d shaded above first line and below second line. which part of the graph best represents the solution set to the system of inequalities y ≥ x + 1 and y + x ≥ −1? a). part a b). part b c). part c d). part d

Answers: 1
 ----> inequality A
 ----> inequality B
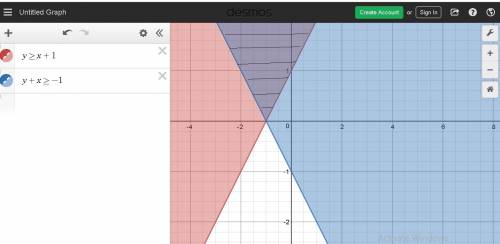


Other questions on the subject: Mathematics
Mathematics, 21.06.2019 18:00, lclaudettecarte3550
Find the number of real number solutions for the equation. x2 + 5x + 7 = 0 0 cannot be determined 1 2
Answers: 2
You know the right answer?
Look at the graph below: first line joins ordered pairs negative 4, 3 and 2, negative 3. second li...
Questions in other subjects:

Biology, 23.11.2020 14:00
Mathematics, 23.11.2020 14:00

Mathematics, 23.11.2020 14:00

Mathematics, 23.11.2020 14:00
Mathematics, 23.11.2020 14:00

Computers and Technology, 23.11.2020 14:00


