Need on interpreting
the bar chart below shows data for a system with two types of particles...

Mathematics, 17.10.2019 21:30 keke6429
Need on interpreting
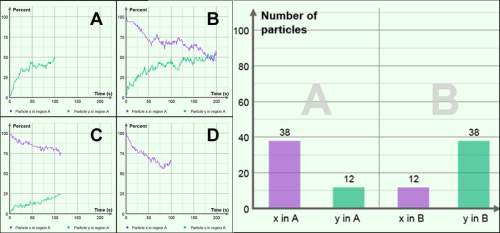
the bar chart below shows data for a system with two types of particles, x and y, in two connected regions, a and b. all of the x particles started in region a, and all of the y particles started in region b. which line graph best depicts the data in the bar chart?
-graph a
-graph b
-graph c
-graph d

Answers: 3


Other questions on the subject: Mathematics
Mathematics, 21.06.2019 18:40, rivera8
Juliana says that she can use the patterns of equivalent ratios in the multiplication table below to write an infinite number of ratios that are equivalent to 6: 10. which statement explains whether juliana is correct? she is correct because she can multiply 6 and 10 by any number to form an equivalent ratio. she is correct because 6: 10 can be written as 1: 2 and there are an infinite number of ratios for 1: 2. she is not correct because the multiplication table does not include multiples of 10. she is not correct because 6: 10 is equivalent to 3: 5 and there are only 9 ratios in the multiplication table that are equivalent to 3: 5.
Answers: 1
Mathematics, 21.06.2019 19:10, jemseidle8889
Click an item in the list or group of pictures at the bottom of the problem and, holding the button down, drag it into the correct position in the answer box. release your mouse button when the item is place. if you change your mind, drag the item to the trashcan. click the trashcan to clear all your answers. solve this quadratic equation using the quadratic formula. 2x2 - 2x=1 need asap
Answers: 2
Mathematics, 21.06.2019 20:00, helplessstudent3
You are shooting hoops after school and make 152 out of a total of 200. what percent of shots did you make? what percent did you miss? show proportion(s).
Answers: 1
Mathematics, 21.06.2019 20:20, jackiediaz
One of every 20 customers reports poor customer service on your company’s customer satisfaction survey. you have just created a new process that should cut the number of poor customer service complaints in half. what percentage of customers would you expect to report poor service after this process is implemented? 1.) 5% 2.) 10% 3.) 2% 4.) 2.5%
Answers: 1
You know the right answer?
Questions in other subjects:

History, 29.02.2020 00:52


