
Mathematics, 27.07.2019 23:10 sydthekid25
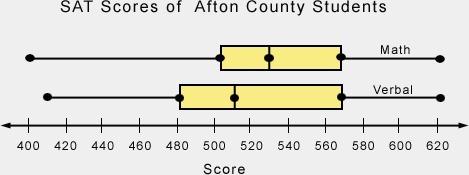
The math and verbal sat scores of students in afton county are represented in the graph below. which plot shows the greater interquartile range? math verbal both plots the same cannot tell from given plots

Answers: 2


Other questions on the subject: Mathematics
Mathematics, 21.06.2019 22:00, Isaiahgardiner5143
Arefrigeration system at your company uses temperature sensors fixed to read celsius (°c) values, but the system operators in your control room understand only the fahrenheit scale. you have been asked to make a fahrenheit (°f) label for the high temperature alarm, which is set to ring whenever the system temperature rises above –10°c. what fahrenheit value should you write on the label?
Answers: 3
Mathematics, 22.06.2019 01:10, ahankaranth
"curse these trig-loving pirates! " devora mutters as she looks at the map. then, after thinking for a moment, she walks back to the entrance of the secret cave, measuring 48 meters along the way. after performing a calculation, devora walks back to the empty treasure, faces the entrance, and turns a certain number of degrees to her left before walking 89 meters to the treasure. supposing that the angle at the cave entrance is acute and that devora's calculations were correct, how many degrees did she turn?
Answers: 2
Mathematics, 22.06.2019 04:30, Geo777
Determine whether the data described are qualitative or quantitative and give their level of measurement if the data are quantitative, state whether they are continuous or discrete. soft drink sizes: small, medium, large. oa. qualitative, nominal o b. qualitative, ordinal- o c. quantitative, ordinal, discrete o d. quantitative, ordinal
Answers: 3
You know the right answer?
The math and verbal sat scores of students in afton county are represented in the graph below. which...
Questions in other subjects:


