Which inequality represents the graph?
a) y < x - 2
b) y > x - 2
c) y ≤...

Mathematics, 21.12.2019 07:31 crom
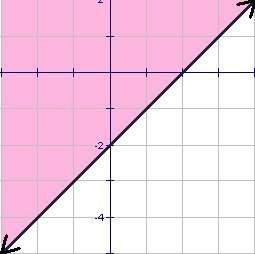
Which inequality represents the graph?
a) y < x - 2
b) y > x - 2
c) y ≤ x - 2
d) y ≥ x - 2

Answers: 1


Other questions on the subject: Mathematics
Mathematics, 21.06.2019 13:30, Rakeem458
Frank has $66.50 in his account on sunday. over the next week, he makes the following changes to his balance via deposits and purchases: day debit ($) credit ($) monday 60.33 80.75 tuesday 54.45 wednesday 49.20 15.00 thursday 35.40 friday 16.85 75.00 saturday 80.56 on what day does frank first get charged an overdraft fee? a. wednesday b. thursday c. friday d. saturday select the best answer from the choices provided a b c d
Answers: 3
Mathematics, 21.06.2019 14:40, beebeck6573
Chose the graph below that represents the following system of inequality’s
Answers: 2
Mathematics, 21.06.2019 15:00, Ruby2480
Abiologist is recording the loss of fish in a pond. he notes the number of fish, f, in the pond on june 1. on july 1 there were 63 fish in the pond, which is 52 fewer fish than were in the pond on june 1. which equation represents this situation? a. f – 52 = 63 b. f – 63 = 52 c. 63 – f = 52 d. f – 63 = –52
Answers: 1
Mathematics, 21.06.2019 15:40, xxaurorabluexx
What is the distance between the points 4,10 and -3,-14 on the coordinate plane
Answers: 2
You know the right answer?
Questions in other subjects:

History, 13.10.2020 14:01

Social Studies, 13.10.2020 14:01

Mathematics, 13.10.2020 14:01
Mathematics, 13.10.2020 14:01

History, 13.10.2020 14:01


