 only
only

The function f(x) is shown on the graph.
what is f(0)?
a 12 only
b 2 and 3...

Mathematics, 10.12.2019 01:31 linag969p9xeno
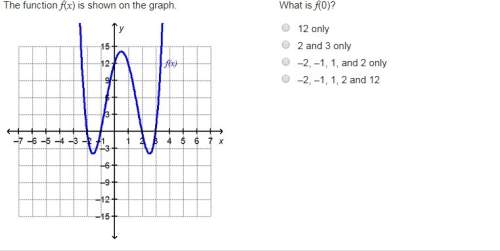
The function f(x) is shown on the graph.
what is f(0)?
a 12 only
b 2 and 3 only
c –2, –1, 1, and 2 only
d –2, –1, 1, 2 and 12
(image provided)

Answers: 2


Other questions on the subject: Mathematics
Mathematics, 21.06.2019 19:10, gurlnerd
1jessica's home town is a mid-sized city experiencing a decline in population. the following graph models the estimated population if the decline continues at the same rate. select the most appropriate unit for the measure of time that the graph represents. a. years b. hours c. days d. weeks
Answers: 2
You know the right answer?
Questions in other subjects:


Mathematics, 14.07.2019 01:20
Mathematics, 14.07.2019 01:20

History, 14.07.2019 01:20


