
Mathematics, 25.07.2019 07:50 avavackity
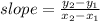
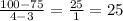
The rate of change is constant in the table. a) find the rate of change and b) explain what the rate change means in the situation time (days) cost (dollars) 3 75 4 100 5 125 6 150

Answers: 1


Other questions on the subject: Mathematics
Mathematics, 21.06.2019 18:00, evarod
The given dot plot represents the average daily temperatures, in degrees fahrenheit, recorded in a town during the first 15 days of september. if the dot plot is converted to a box plot, the first quartile would be drawn at __ , and the third quartile would be drawn at link to the chart is here
Answers: 1
Mathematics, 21.06.2019 18:30, Lakenwilliams1250
Select 2 statements that are true about the equation y+6=-10(x-3).1) the slope of the line is -102) the slope of the line is 33) one point on the line is (3,6)4) one point on the line is (3,-6)
Answers: 1
Mathematics, 21.06.2019 22:30, Elenegoggg
Which of the following graphs could represent a quartic function?
Answers: 1
You know the right answer?
The rate of change is constant in the table. a) find the rate of change and b) explain what the rate...
Questions in other subjects:
Mathematics, 11.03.2021 18:10
Mathematics, 11.03.2021 18:10
Mathematics, 11.03.2021 18:10

Mathematics, 11.03.2021 18:10

Mathematics, 11.03.2021 18:10


