
Mathematics, 14.11.2019 15:31 taylorclarkx17
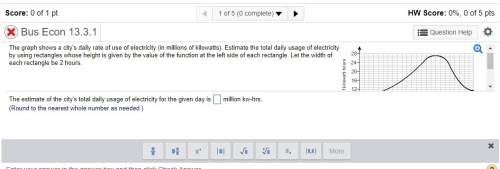
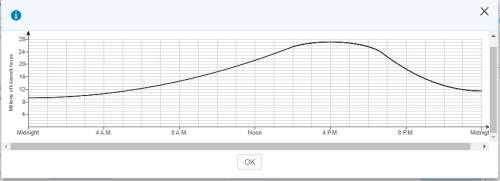
The graph shows a city's daily rate of use of electricity (in millions of kilowatts). estimate the total daily usage of electricity by using rectangles whose height is given by the value of the function at the left side of each rectangle. let the width of each rectangle be 2 hours.

Answers: 1


Other questions on the subject: Mathematics
Mathematics, 21.06.2019 15:30, lberman2005p77lfi
Answer question above and explain each step : )
Answers: 3
Mathematics, 21.06.2019 19:20, cody665
1- what do you think the product of a nonzero rational number and an irrational number is? is it rational or irrational? make use of variables, the closure property of integers, and possibly a proof by contradiction to prove your hypothesis.2- why do we have to specify that the rational number must be nonzero when we determine what the product of a nonzero rational number and an irrational number is? if the rational number were 0, would it give us the same result we found in the first question?
Answers: 2
Mathematics, 21.06.2019 23:00, nails4life324
Which of the following scenarios demonstrates an exponential decay
Answers: 1
You know the right answer?
The graph shows a city's daily rate of use of electricity (in millions of kilowatts). estimate the t...
Questions in other subjects:

History, 16.10.2019 14:50

Health, 16.10.2019 14:50

History, 16.10.2019 14:50

Mathematics, 16.10.2019 14:50


