Mathematics, 24.07.2019 17:30 jdmXdude3140
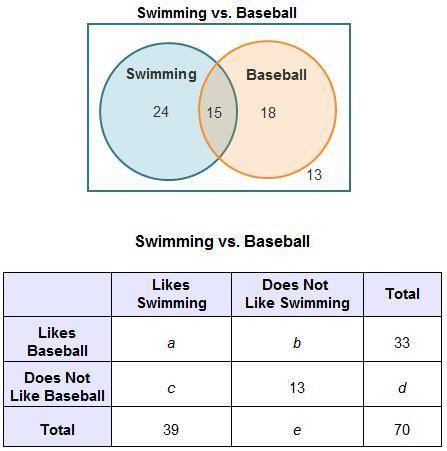
Agroup of campers were polled about whether they like swimming and whether they like playing baseball. the data from the survey is shown in the venn diagram. use the venn diagram to find the missing values in the frequency table. which values are correct?

Answers: 1


Other questions on the subject: Mathematics

Mathematics, 21.06.2019 14:50, bustillojoshua4
On a piece of paper, graph . then determine which answer choice matches the graph you drew
Answers: 1

Mathematics, 21.06.2019 21:30, spooderfaxy7813
Rhombus adef is inscribed into a triangle abc so that they share angle a and the vertex e lies on the side bc . what is the length of the side of the rhombus if ab=c, and ac=b.
Answers: 1


Mathematics, 22.06.2019 00:00, egirl7838
Titus works at a hotel. part of his job is to keep the complimentary pitcher of water at least half full and always with ice. when he starts his shift, the water level shows 4 gallons, or 128 cups of water. as the shift progresses, he records the level of the water every 10 minutes. after 2 hours, he uses a regression calculator to compute an equation for the decrease in water. his equation is w –0.414t + 129.549, where t is the number of minutes and w is the level of water. according to the equation, after about how many minutes would the water level be less than or equal to 64 cups?
Answers: 2
You know the right answer?
Agroup of campers were polled about whether they like swimming and whether they like playing basebal...
Questions in other subjects:


Mathematics, 08.04.2020 20:03

Mathematics, 08.04.2020 20:03

Social Studies, 08.04.2020 20:03


Mathematics, 08.04.2020 20:03

Mathematics, 08.04.2020 20:03

Biology, 08.04.2020 20:03


