
Mathematics, 20.07.2019 07:20 jeffcarpenter
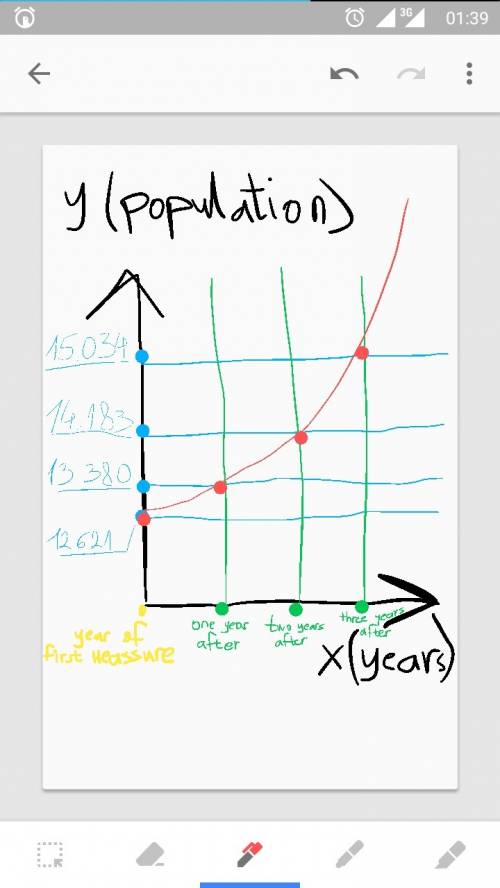
The first time a census was taken in esinville, the population was 12,621. each year after that, the population was about 6% higher than it was the previous year. sketch the graph that represents the situation. let x represent the number of years since the first census was taken. what are the coordinates of the point that contains the y-intercept? although answers are nice, i need step by step to me understand how to solve this. its exponential growth i believe?

Answers: 1


Other questions on the subject: Mathematics
Mathematics, 21.06.2019 19:00, morgeron6071
Which statement best explains why ben uses the width hi to create the arc at j from point k
Answers: 2
You know the right answer?
The first time a census was taken in esinville, the population was 12,621. each year after that, the...
Questions in other subjects:


