
Mathematics, 14.07.2019 10:40 jdsfdujfi8572
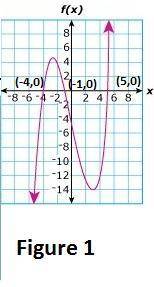
What is (are) the x-intercepts of the function graphed above?

Answers: 1


Other questions on the subject: Mathematics
Mathematics, 21.06.2019 13:30, SenpaiTaii
Which statement holds true for absolute value functions? •the absolute value determines the direction in which theb. the coefficient determines the line along which the graph, the distance between the left and the right arm is based od. the vertex coordinates and the absolute value determine 111
Answers: 3
Mathematics, 21.06.2019 14:30, Heyitsbrandi
Aparking lot is to be 400 feet wide and 370 feet deep. how many standard-sized cars fit in this lot considering a double-loaded (w4) two way traffic set up, an angle of 90° and a sw of 9’ 0’’? (do not consider handicapped parking spaces, and consider 15’ for turning aisles). show your work.
Answers: 2
Mathematics, 21.06.2019 16:00, kell22wolf
Part one: measurements 1. measure your own height and arm span (from finger-tip to finger-tip) in inches. you will likely need some from a parent, guardian, or sibling to get accurate measurements. record your measurements on the "data record" document. use the "data record" to you complete part two of this project. name relationship to student x height in inches y arm span in inches archie dad 72 72 ginelle mom 65 66 sarah sister 64 65 meleah sister 66 3/4 67 rachel sister 53 1/2 53 emily auntie 66 1/2 66 hannah myself 66 1/2 69 part two: representation of data with plots 1. using graphing software of your choice, create a scatter plot of your data. predict the line of best fit, and sketch it on your graph. part three: the line of best fit include your scatter plot and the answers to the following questions in your word processing document 1. 1. which variable did you plot on the x-axis, and which variable did you plot on the y-axis? explain why you assigned the variables in that way. 2. write the equation of the line of best fit using the slope-intercept formula $y = mx + b$. show all your work, including the points used to determine the slope and how the equation was determined. 3. what does the slope of the line represent within the context of your graph? what does the y-intercept represent? 5. use the line of best fit to you to describe the data correlation.
Answers: 2
Mathematics, 21.06.2019 18:30, amylumey2005
What can each term of the equation be multiplied by to eliminate the fractions before solving? x – + 2x = + x 2 6 10 12
Answers: 2
You know the right answer?
What is (are) the x-intercepts of the function graphed above?...
Questions in other subjects:

Mathematics, 19.03.2021 18:20


