
Mathematics, 08.07.2019 03:40 tddreviews
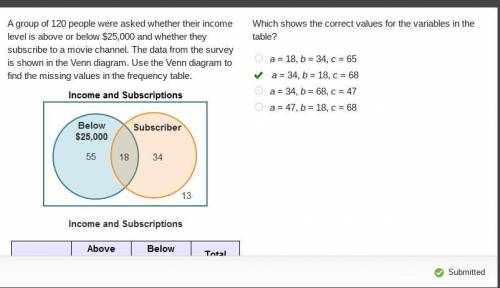
Agroup of 120 people were asked whether their income level is above or below $25,000 and whether they subscribe to a movie channel. the data from the survey is shown in the venn diagram. use the venn diagram to find the missing values in the frequency table. which shows the correct values for the variables in the table? a. a = 18, b = 34, c = 65 b. a = 34, b = 18, c = 68c. a = 34, b = 68, c = 47d. a = 47, b = 18, c = 68

Answers: 1


Other questions on the subject: Mathematics
Mathematics, 21.06.2019 12:30, negativechill
Natasha spent 1 1/2 hours on the beach. she fell asleep for 3/4 of the time she was on the beach and then woke up with a terrible sunburn. how many hours was natasha asleep on the beach?
Answers: 2
Mathematics, 21.06.2019 21:00, Mathcat444
The zoo collects $9.60 for every 24 tickets sold. how much will be collected for 400 tickets?
Answers: 2
Mathematics, 22.06.2019 03:20, arangoaiden71
Aconcession manager at yankee stadium wants to know how temperature affects beer sales. she took a sample of 10 games and recorded the number of beers sold and the temperature in the middle of the game. temperature 80 68 78 79 87 74 86 92 77 84 number of beers 20533 1439 13829 21286 30985 17187 30240 87596 9610 28742 a. draw a scatter plot of the data. b. the manager estimates the regression equation to be: numberofbeers = −100, 678 + 1, 513 ∗ temperature draw this on your scatter plot. c. for one of the estimated points, indicate the residual with ei . d. for that same point, indicate what part of the variation is explained by the model with ˆyi − y¯.
Answers: 2
You know the right answer?
Agroup of 120 people were asked whether their income level is above or below $25,000 and whether the...
Questions in other subjects:

Social Studies, 12.11.2019 04:31
Mathematics, 12.11.2019 04:31
Mathematics, 12.11.2019 04:31

Chemistry, 12.11.2019 04:31

Computers and Technology, 12.11.2019 04:31
Mathematics, 12.11.2019 04:31


