
Mathematics, 08.07.2019 02:20 marialegarda4211
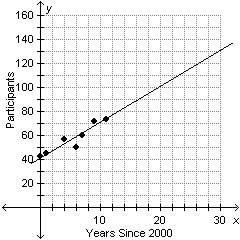
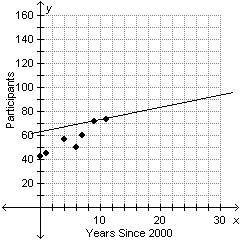
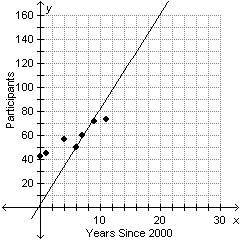
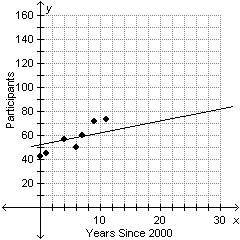
Irina plotted the number of participants in a summer camp program on a coordinate plane to create the following scatterplot. which graph shows the line of best fit for this scatterplot?

Answers: 2


Other questions on the subject: Mathematics
Mathematics, 21.06.2019 18:00, kezin
The sat and act tests use very different grading scales. the sat math scores follow a normal distribution with mean 518 and standard deviation of 118. the act math scores follow a normal distribution with mean 20.7 and standard deviation of 5. suppose regan scores a 754 on the math portion of the sat. how much would her sister veronica need to score on the math portion of the act to meet or beat regan's score?
Answers: 1
Mathematics, 21.06.2019 20:30, adityamahesh2002
In the diagram of circle o, what is the measure of zabc?
Answers: 2
Mathematics, 21.06.2019 21:30, oliup567
(c) the diagram shows the first three shapes of a matchsticks arrangement. first shape = 3second shape = 5third shape = 7given m represents the number of matchstick used to arrange the n'th shape.(i) write a formula to represent the relation between m and n. express m as the subjectof the formula.(ii) 19 matchsticks are used to make the p'th shape. find the value of p.
Answers: 2
Mathematics, 22.06.2019 03:00, foziasif9525
Gia opened two savings accounts at two different banks. one account earns an annual 3.4% simple interest, and the other earns half as much. if she deposited $500 in each account, how much total interest will she have earned in 5 years? a. $34.00 b. $25.50 c. $51.00 d. $510.00
Answers: 1
You know the right answer?
Irina plotted the number of participants in a summer camp program on a coordinate plane to create th...
Questions in other subjects:

Mathematics, 31.08.2020 03:01

Mathematics, 31.08.2020 03:01

Spanish, 31.08.2020 03:01


Chemistry, 31.08.2020 03:01


