
Mathematics, 30.06.2019 15:00 mariasoledad1
The graph of f(x) = x2 is translated to form g(x) = (x – 5)2 + 1.which graph represents g(x)?

Answers: 2
 and the graph of
 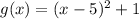 . These two graphs are illustrated in the Figure bellow. So, let's explain what this means:


Other questions on the subject: Mathematics
Mathematics, 21.06.2019 16:30, jayjay5246
Translate this phrase into an algebraic expression. 21 more than twice goran's savings use the variable g to represent goran's savings. need to know fast.
Answers: 1
Mathematics, 21.06.2019 17:30, apexdude2020
The swimming pool is open when the high temperature is higher than 20∘c. lainey tried to swim on monday and thursday (which was 33 days later). the pool was open on monday, but it was closed on thursday. the high temperature was 30 ∘c on monday, but decreased at a constant rate in the next 33 days. write an inequality to determine the rate of temperature decrease in degrees celsius per day, d, from monday to thursday.
Answers: 3
Mathematics, 21.06.2019 19:00, 592400014353
The test scores of 32 students are listed below. construct a boxplot for the data set and include the values of the 5-number summary. 32 37 41 44 46 48 53 55 57 57 59 63 65 66 68 69 70 71 74 74 75 77 78 79 81 82 83 86 89 92 95 99
Answers: 1
Mathematics, 21.06.2019 21:40, skylarbrown018
The number of chocolate chips in a bag of chocolate chip cookies is approximately normally distributed with a mean of 12611261 chips and a standard deviation of 118118 chips. (a) determine the 2626th percentile for the number of chocolate chips in a bag. (b) determine the number of chocolate chips in a bag that make up the middle 9696% of bags. (c) what is the interquartile range of the number of chocolate chips in a bag of chocolate chip cookies?
Answers: 2
You know the right answer?
The graph of f(x) = x2 is translated to form g(x) = (x – 5)2 + 1.which graph represents g(x)?...
Questions in other subjects:
Mathematics, 03.08.2021 18:40

Computers and Technology, 03.08.2021 18:40

Health, 03.08.2021 18:40
Mathematics, 03.08.2021 18:40
Mathematics, 03.08.2021 18:40


