Mathematics, 13.04.2022 08:40 kromaug1517
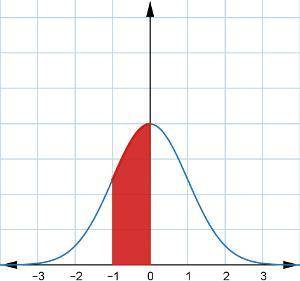
Consider this graph of a standard normal curve.
What percentage of data is represented by the shaded area?
Enter your answer as a number, like this: 42%


Answers: 1


Other questions on the subject: Mathematics


Mathematics, 21.06.2019 18:00, Kellystar27
Someone this asap for a group of students attends a basketball game. * the group buys x hot dogs at the concession stand for $2 each. * the group buys y drinks at the concession stand for $3 each. the group buys 29 items at the concession stand for a total of $70. how many hot dogs did the group buy?
Answers: 1

Mathematics, 21.06.2019 23:00, hlhunter11p8f0o0
Jane’s favorite fruit punch consists of pear, pineapple, and plum juices in the ratio 5: 2: 3. chapter reference how much punch can she make if she has only 6 cups of plum juice?
Answers: 1

Mathematics, 21.06.2019 23:00, erbnichole
Graph the system of equations on your graph paper to answer the question. {y=−x+4y=x−2 what is the solution for the system of equations? enter your answer in the boxes.
Answers: 1
You know the right answer?
Consider this graph of a standard normal curve.
What percentage of data is represented by the shad...
Questions in other subjects:


Biology, 19.07.2019 09:40


Health, 19.07.2019 09:40

Geography, 19.07.2019 09:40

Geography, 19.07.2019 09:40


