
Mathematics, 01.04.2022 22:10 ujusdied5176
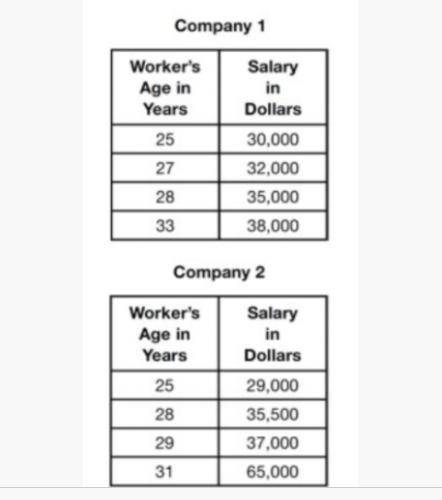
Isaiah collects data from two different companies, each with four employees. The results of the study, based on each worker's age and salary, are listed in the tables below. Which statement is true about this data?
(a) The median salaries in both companies are greater than $37,000.
(b) The mean salary in company 1 is greater than the mean salary in company 2.
(c) The mean salary in company 2 is greater than the mean salary in company 1.
(d) The salary range in company 2 is the same as the salary tange in company 1.
(e) The salary range in company 1 is greater than the salary range in company 2.

Answers: 3


Other questions on the subject: Mathematics
Mathematics, 21.06.2019 17:30, msdmdsm1186
Danielle earns a 7.25% commission on everything she sells at the electronics store where she works. she also earns a base salary of $750 per week. what were her sales last week if her total earnings for the week were $1,076.25?
Answers: 3
Mathematics, 22.06.2019 00:00, blachaze8729
Darragh has a golden eagle coin in his collection with a mass of 13.551\,\text{g}13.551g. an uncirculated golden eagle coin has a mass of 13.714\,\text{g}13.714g.
Answers: 2
Mathematics, 22.06.2019 01:50, charrsch9909
Leonardo wrote an equation that has an infinite number of solutions. one of the terms in leonardo’s equation is missing, as shown below.
Answers: 2
Mathematics, 22.06.2019 02:30, misk980
Atrain traveled for 1.5 hours to the first station, stopped for 30 minutes, then traveled for 4 hours to the final station where it stopped for 1 hour. the total distance traveled is a function of time. which graph most accurately represents this scenario? a graph is shown with the x-axis labeled time (in hours) and the y-axis labeled total distance (in miles). the line begins at the origin and moves upward for 1.5 hours. the line then continues upward at a slow rate until 2 hours. from 2 to 6 hours, the line continues quickly upward. from 6 to 7 hours, it moves downward until it touches the x-axis a graph is shown with the axis labeled time (in hours) and the y axis labeled total distance (in miles). a line is shown beginning at the origin. the line moves upward until 1.5 hours, then is a horizontal line until 2 hours. the line moves quickly upward again until 6 hours, and then is horizontal until 7 hours a graph is shown with the axis labeled time (in hours) and the y-axis labeled total distance (in miles). the line begins at the y-axis where y equals 125. it is horizontal until 1.5 hours, then moves downward until 2 hours where it touches the x-axis. the line moves upward until 6 hours and then moves downward until 7 hours where it touches the x-axis a graph is shown with the axis labeled time (in hours) and the y-axis labeled total distance (in miles). the line begins at y equals 125 and is horizontal for 1.5 hours. the line moves downward until 2 hours, then back up until 5.5 hours. the line is horizontal from 5.5 to 7 hours
Answers: 1
You know the right answer?
Isaiah collects data from two different companies, each with four employees. The results of the stud...
Questions in other subjects:


Mathematics, 02.03.2020 20:54


History, 02.03.2020 20:54
Mathematics, 02.03.2020 20:54


