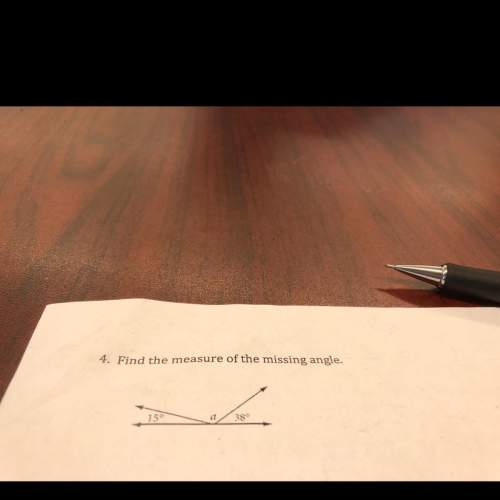
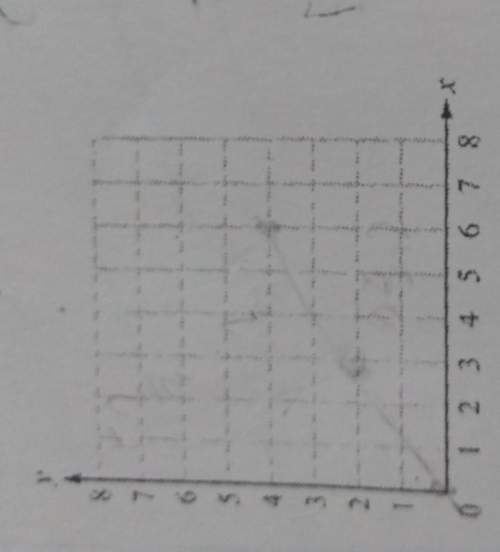
Look at the table below. Which equation shows the relationship of the values?
sorry its long
...

Mathematics, 20.03.2022 05:40 kcruz87
Look at the table below. Which equation shows the relationship of the values?
sorry its long
x
2
4
7
11
15
y
3
7
13
21
29

Answers: 3


Other questions on the subject: Mathematics
Mathematics, 21.06.2019 17:30, bradleycawley02
Lems1. the following data set represents the scores on intelligence quotient(iq) examinations of 40 sixth-grade students at a particular school: 114, 122, 103, 118, 99, 105, 134, 125, 117, 106, 109, 104, 111, 127,133, 111, 117, 103, 120, 98, 100, 130, 141, 119, 128, 106, 109, 115,113, 121, 100, 130, 125, 117, 119, 113, 104, 108, 110, 102(a) present this data set in a frequency histogram.(b) which class interval contains the greatest number of data values? (c) is there a roughly equal number of data in each class interval? (d) does the histogram appear to be approximately symmetric? if so, about which interval is it approximately symmetric?
Answers: 3
Mathematics, 21.06.2019 23:30, pinkygirlp1662
The triangle shown has a hypotenuse with a length of 13 feet. the measure of angle a is 20 degrees. and the measure of angle b is 70 degrees. which of the following is closest to the length, in feet, of line segment ac? no need to use a calculator to find the trig numbers. each function is listed below. 4.4 5 12.2 35.7
Answers: 2
You know the right answer?
Questions in other subjects:

Mathematics, 04.09.2020 22:01

Social Studies, 04.09.2020 22:01
Mathematics, 04.09.2020 22:01
English, 04.09.2020 22:01


Biology, 04.09.2020 22:01
Mathematics, 04.09.2020 22:01


